 Eric Joern
EPA Responds to the Freedom to Fix Memo: What Changed for Your Shop
One of the biggest questions after the memorandum came out was simple: now what? The answer came fast. Within two days, the EPA issued guidance...
If you’re putting in the hours but not seeing the profit you should, it’s not your work ethic that’s the problem. It’s what you’re measuring.
The right metrics will show you exactly where profit is slipping and where to focus your energy to turn it around.
In this guide, we’ll walk through the six key metrics every auto repair shop should measure each month. We’ll show how to calculate each one in QuickBooks Online, what healthy targets look like, and what to do if your numbers don’t line up.
We look at two views every month: Last Month and This Fiscal Year to Last Month. We’ll use both to track your monthly performance and your year-to-date trends.
Last Month – to track how you did most recently
This Fiscal Year to Last Month – to see your year-to-date progress
Go to Reports → Profit and Loss.
Set the Report period to Last month.
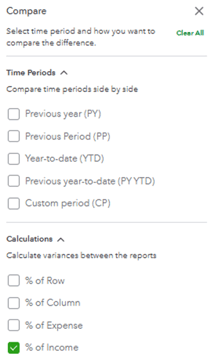
Click the Compare to open the side panel
Under Calculations, check % of Income
Click Run report.
Then repeat with Report period = This fiscal year to last month to see your year-to-date progress.
Tip: Click Save customization for each version and title them “P&L Monthly Metrics” and “P&L YTD Metrics” so you can pull them up quickly each month.
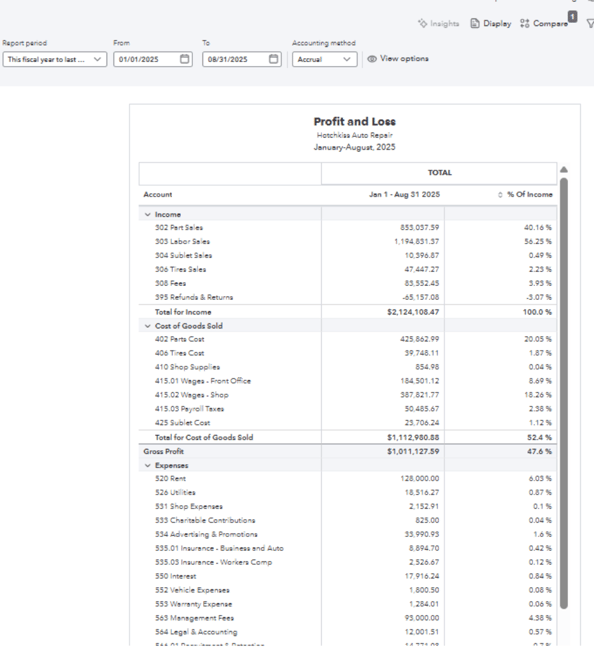
Now your report will include a % of Income column next to each line item so you can see how every income and expense category relates to total revenue. We’ll use these reports to measure the six key metrics below.
Note: QuickBooks will calculate these percentages automatically. As long as your chart of accounts is set up correctly, you can read each metric directly from your P&L, with no extra math required.
If your Chart of Accounts isn’t set up to separate income and costs clearly, for example, if tech wages and office wages or payroll taxes are mixed together, we’ll clean that up. You need accurate numbers to measure these metrics the right way.
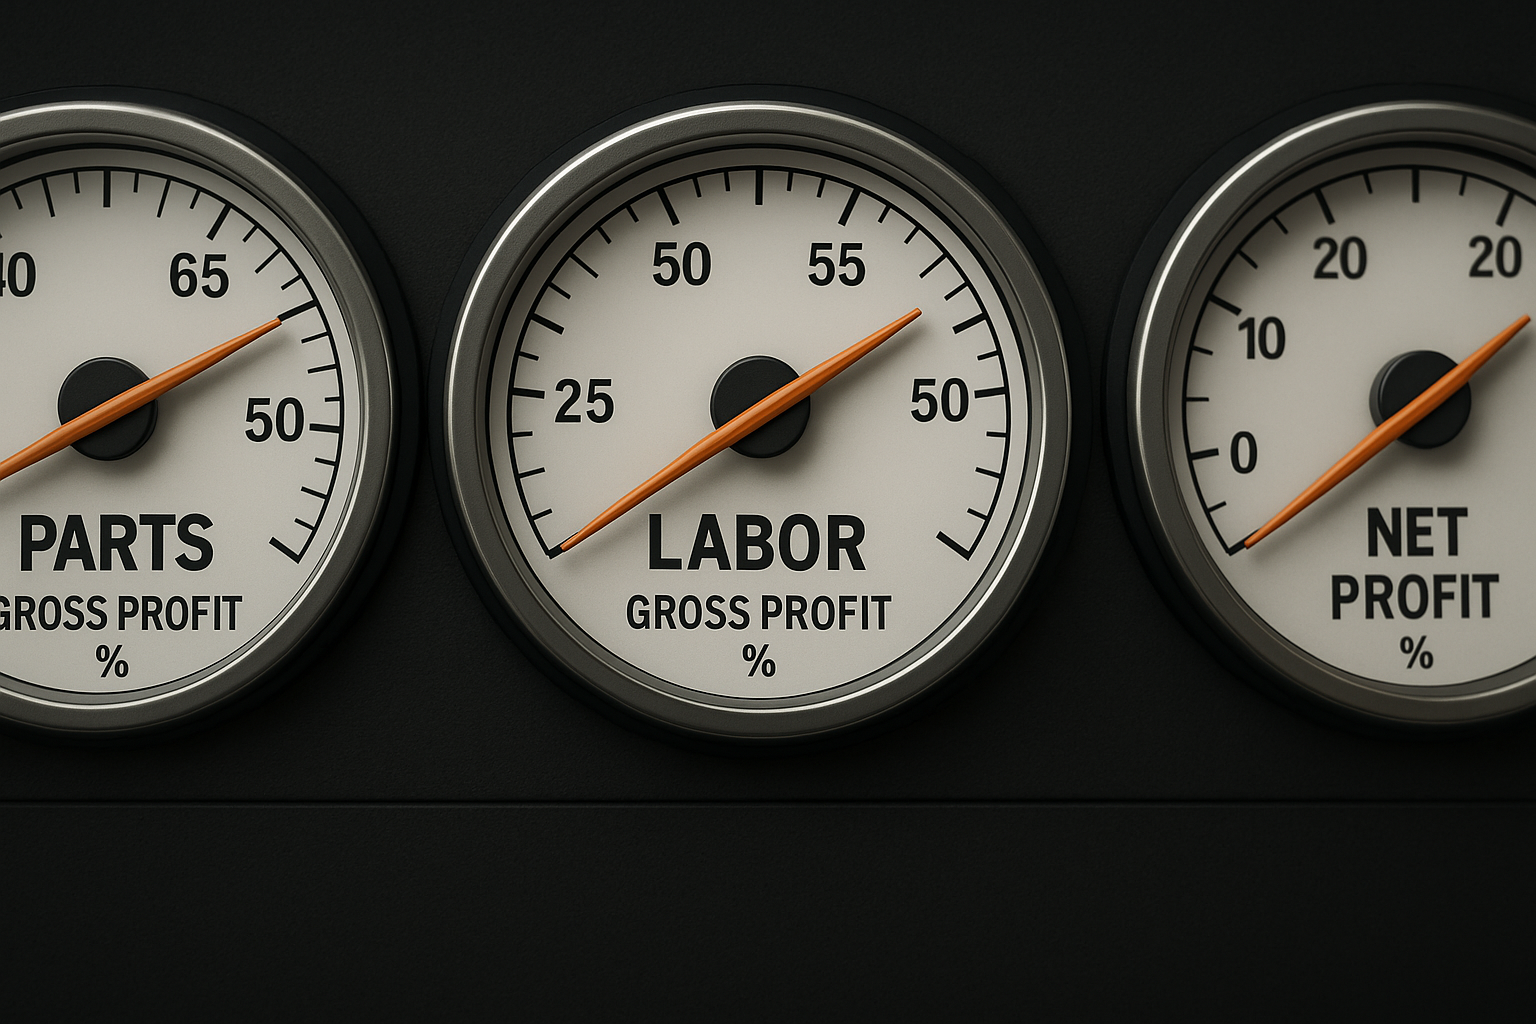
Target: 50–55%
As a shop, we sell two primary things: parts and labor. To ensure we’re meeting our target gross profit, we measure each one independently. That helps confirm that pricing, product mix, and efficiency are all working together.
Our Parts Gross Profit number shows how profitable parts sales are after subtracting what we paid for them. If the margin is too low, it usually means we’re discounting too much, not billing for every part used, or paying too much for inventory.
We take our Parts Sales, subtract our Parts Cost, and then divide the difference by Parts Sales.
Example:
$853,037.59 – $425,862.99 = $427,174.60
$427,174.60 ÷ $853,037.59 = 50.08% gross profit

Some shops choose to measure Parts Cost as a % of Total Income. If your parts and labor mix is close to 50/50, then 25% parts cost equals roughly 50% gross profit. This approach is easier to eyeball since it uses the % of income column.
If you’re currently at 30% or 40%, aim to improve in small steps, maybe 5% at a time, until you reach the target. A sudden large increase in pricing can shock loyal customers.
Review your parts pricing matrix to confirm markups are scaling correctly.
Assess your repair mix. A higher volume of maintenance work usually produces better margins than big-ticket replacements.
Make changes gradually to help customers adjust.
We’ve seen shops move from 42% to over 50% just by tightening their pricing matrix and balancing their mix.
Target: 65–70%
This metric reflects both pricing and efficiency. It shows how well we’re turning labor sales into profit. When it’s strong, we know our labor rate is healthy, our technicians are efficient, and we’re billing accurately for the work we do.
If it’s lower than it should be, it often means we’re underpriced, paying too much in wages for the rate we charge, or losing hours that should have been billed. A healthy labor margin is one of the biggest drivers of profit in any shop.
We start with Labor Sales, subtract technician Labor Cost, and divide the difference by Labor Sales.
Example:
$1,194,831.37 – $387,821.77 = $807,009.60
$807,009.60 ÷ $1,194,831.37 = 67.54% gross profit

We recommend including only employees directly involved in producing the work, such as technicians, apprentices, and shop helpers. Service advisors are excluded.
We use unloaded wages (wages only, without benefits or taxes) so the metric reflects true labor cost. That way, we can compare performance consistently from month to month and across shops.
Monitor technician efficiency
Compare billed hours to total hours worked. A tech producing 60 billed hours in a 40-hour week has a much lower cost per hour than one producing only 20.
Add a labor matrix
Apply premiums for complex or time-intensive jobs.
We’ve helped shops boost profit by thousands each month just by improving efficiency and visibility into labor margins.
Target: 20%
This is your bottom line. It’s what’s actually left after you’ve covered every expense in the business. It shows whether your pricing, productivity, and spending are working together the way they should. We focus on operating net profit, which reflects how your shop performs day to day. We leave out one-time items like selling an asset or earning interest so we can see your real results.
When we measure net profit, we start with Total Income, subtract Total COGS and Total operating Expenses, and divide the difference by Total Income.
Example:
$2,124,108.47 – $1,537,032.79 = $587,075.68
$587,075.68 ÷ $2,124,108.47 = 27.64% net profit

If your net profit isn’t hitting the 20% mark, that’s a signal to dig into what’s driving the difference. Here’s where we start when we’re looking at this with a client:
When we work with shops that hit their target net profit, we often shift the focus to net income dollars, because those dollars can reward the owner, fund reinvestment, or support team bonuses.
Target: 40% or less
Overhead includes everything it takes to keep your doors open that isn’t directly tied to producing work, such as rent, utilities, insurance, admin pay, and marketing. When overhead runs high, even strong sales can feel like they are not adding up. The goal is not necessarily to cut costs across the board but to make sure every dollar supports productivity and profit.
We’ve seen owners surprised to discover they were spending 10% more on overhead than top-performing shops simply because they weren’t tracking it monthly.
This metric is pretty simple, but it's one shop owners know. We divide Total Expenses (not including COGS) by Total Income.
Example:
$424,051.91 ÷ $2,124,108.47 = 19.96% overhead

How to Improve It
When we review overhead with a shop, we’re not just trimming costs. We’re making sure your systems, spending, and people are all supporting profit.
Target: 13.5% combined
Rent and advertising are two of the biggest controllable costs that directly affect your bottom line. Together, they show how efficiently your space and your marketing dollars are supporting sales. When one increases, the other often needs to come down to keep total overhead in line.
We look at rent and advertising as a combined percentage of total income. We start with Rent Expense and Advertising Expense. Add them together, then divide by Total Income.
Example:
$112,457.93 + $179,539.41 = $291,997.34
$291,997.34 ÷ $2,124,108.47 = 13.75% rent + advertising

Rent and advertising often balance each other. A shop right off the highway with a visible sign may pay premium rent but gets constant calls with minimal marketing, while a shop tucked away in an industrial park pays low rent but needs strong marketing to attract customers.
| Scenario | Rent % | Advertising % | Total |
|---|---|---|---|
| High-rent location with steady foot traffic | 10% | 3.5% | 13.5% |
| Lower-rent location requiring more marketing | 5% | 8.5% | 13.5% |
Track your marketing ROI. If your shop is not full, evaluate your current marketing spend and increase it where it makes sense. Advertising should bring in qualified cars, not just clicks or calls.
Evaluate your space and occupancy cost. If your market cannot support your current rent, look at creative ways to fill capacity, such as fleet accounts, subleasing, or relocation.
Give marketing time to work. New campaigns often take three to six months to show steady results. Track them consistently before making changes.
Keep the balance in check. Rent and advertising often trade off. A higher-rent location might need less marketing, while a lower-rent shop may require more to stay booked. The goal is for the combined percentage to stay in range.
Target: 5-7%
Service advisors are the link between your technicians and your customers. Their performance has a major impact on car count, average repair order (ARO), and customer satisfaction. Tracking their wages as a percentage of total income helps us see whether compensation aligns with the shop’s productivity and sales volume.
We divide Service Advisor Wages (Front Office Wages) by Total Income.
Example:
$128,091.32 ÷ $2,124,108.47 = 6.03% service advisor wages

We look for efficient, performance-based structures where advisor pay is aligned with revenue and gross profit growth.
Set sales goals per advisor. Each advisor should know their individual targets for car count, closing ratio, and ARO.
Ensure the 300% rule is executed on every vehicle. Every issue should be inspected, estimated, and presented — every time.
Tie incentives to overall sales or gross profit targets. Pay plans should reward total shop performance, not just individual tickets.
Watch the percentage monthly. If advisor wages climb but sales do not, look closer at productivity and staffing balance.
Strong advisors drive both sales and trust. This metric helps us make sure their compensation reflects performance and supports profitability. We’ve seen shops reduce advisor wage percentages by improving training and aligning pay with production goals.
Each month, run your Profit & Loss report with the % of Income column turned on and compare your results to these targets. Then review your year-to-date trends to see how your shop is performing over time.
Consistent tracking helps us catch issues early, make smart adjustments, and build predictable, sustainable profitability.
You don’t need to guess where your money is going. The numbers will tell you, as long as you’re looking at the right ones.
Tracking these six essential metrics every month gives you a clear picture of what’s driving your shop’s performance and where to focus your attention next.
The best shops don’t hope for profit. They plan for it.
Explore the Kaizen Resource Center for practical tools, articles, and videos that help you run a more profitable, predictable shop.
If you want to see how Kaizen can support your business with clear financials, proactive tax planning, and industry-specific guidance, schedule a call with our team.

YPD HCM is part of the Kaizen CPAs family. YPD HCM specializes in payroll and HR compliance for small businesses, providing the hands-on support to get your people paid and stay compliant without having to become an expert yourself.
The information in this article is provided for general educational purposes and reflects conditions as of the publication date. It does not constitute legal, tax, or compliance advice. For guidance specific to your business, consult a qualified professional.

One of the biggest questions after the memorandum came out was simple: now what? The answer came fast. Within two days, the EPA issued guidance...

President Trump did not sign the REPAIR Act. He signed a memorandum called Freedom to Fix, directing the EPA to review how it handles...

Every January, the same resolutions show up everywhere: eat better, stress less, save more money, work on yourself. Auto repair shop owners make...